

|
Getting your Trinity Audio player ready...
|
A cyber attack graph is a representation of all possible paths of attack against a cybersecurity network, illustrating a state where an attacker has completed a successful breach. There are two popular forms of attack graphs. The first is a direct graph where nodes represent network states and edges represent exploits that transform one state into a more compromised state, ultimately showing a successful attack. A second form is a direct graph where nodes represent pre or post-conditions of an exploit, and edges represent the consequences of having a pre-condition that enables an exploit post-condition.
Importance of Attack Graphs in Threat Analysis
Attack graphs are valuable tools for understanding and managing cybersecurity threats across a network. Their importance in threat analysis includes:
- Visualizing the security posture: They provide a unified view of how systems are connected and where vulnerabilities exist, helping teams understand the overall security landscape.
- Identifying critical vulnerabilities: By showing possible paths an attacker could take, attack graphs reveal high-impact vulnerabilities that might be missed in standard assessments.
- Supporting risk-based decision-making: The visual structure helps prioritize security investments by focusing attention on the most vulnerable and interconnected parts of the network.
- Predicting attacker behavior: They allow teams to simulate how an attacker might move laterally, escalate privileges, or chain exploits, helping prepare defenses before an attack happens.
- Improving defense strategies: With better insight into potential attack paths, security teams can design more focused and proactive mitigation plans.
The Use of Attack Graphs
Cybersecurity defenses must be continuously tested to ensure optimal asset protection. Scanning a network and identifying vulnerabilities, however, does not go far enough. Today’s networks feature multiple platforms and diverse software products, resulting in multiple layers of connectivity. The complexity of such environments poses a serious challenge to even the most conscientious security teams.
For deeper insight into overall risk, it is important to understand how vulnerabilities interact with hosts and with each other. By understanding this level of complexity and gaining visibility into how exposures are likely to be exploited — using the perspective of adversaries and charting their likely attack paths — organizations develop fuller insight into their true state of risk.
The use of a cyber attack graph is a key part of this process. Attack graphs can be used to construct multi-stage attack paths where each path represents a chain of exploits that could be leveraged by an attacker to penetrate a network. Attack graph techniques, therefore, are critical to understanding not only where vulnerabilities exist, but how they are most likely to be exploited, and what that means for an organization in terms of protecting high-value assets.
Attack Graph vs. Attack Tree
While attack graphs and attack trees both model potential attack scenarios, they differ in structure, use cases, and level of detail.
Attack trees use a hierarchical, tree-like structure where the root node represents the attacker’s goal, and branches represent different ways to achieve that goal. Each leaf node is a basic step or condition. Trees are usually easier to interpret and are often used for high-level threat modeling or security policy analysis. They work well when analyzing a single system or a specific attack scenario.
Attack graphs use a directed graph structure that models system states and the transitions between them. These transitions are often driven by exploits or changes in privileges. Unlike trees, graphs can represent complex relationships, such as shared dependencies or multiple attack paths converging at a single state. This makes attack graphs more suitable for modeling real-world enterprise networks, where attackers may chain multiple vulnerabilities across hosts.
Another key difference lies in scalability:
- Attack trees are relatively static and can become cumbersome in large environments.
- Attack graphs are more flexible and better suited to automated generation and analysis, especially when combined with vulnerability scanners and threat intelligence feeds.
Components of an Attack Graph
Attack graphs model how attackers can exploit systems by combining vulnerabilities and access paths. Each graph is made up of specific components that define how attacks begin, progress, and succeed. Below are the main elements:
- Nodes: Represent entities or states within the network. These can include hosts, services, user privileges, system configurations, or specific conditions before or after an exploit. Nodes show what the attacker can access or control at each stage.
- Edges: Indicate transitions between nodes. Each edge represents an exploit or action that moves the attacker from one state to another. They define how an attacker progresses through the network.
- State information: Describes the current environment being modeled, such as open ports, running services, user access levels, and vulnerability status. Accurate state data is essential for identifying realistic attack paths.
- Attack actions: Define specific steps an attacker might take, such as exploiting a vulnerability, escalating privileges, or moving laterally. Each action is tied to conditions that must be met and the resulting changes in system state.
- Constraints: Set the boundaries for valid attack paths. These include system requirements, prerequisites for exploits, resource limitations, and any contextual conditions that must be satisfied for an action to succeed. Constraints help eliminate unrealistic or irrelevant attack scenarios.
How Enterprises Use Automated Attack Graphs to Protect Critical Assets
Red teams — also commonly referred to as “ethical hackers” — assume the role of adversaries, then proceed to test an organization’s cybersecurity defenses by developing and launching attacks against uncovered vulnerabilities. Historically, red teams have drawn massive attack graphs by hand to identify vulnerabilities in networked systems.
However, this manual graphing process requires enormous effort when dealing with larger systems and is exceptionally tedious. Like many manual cybersecurity processes, it is also highly dependent on the variable skill of those undertaking the process and thus prone to error.
Automated attack graphing has become much more widely adopted across the broader security organization (not just red teams) in recent years, as organizations increasingly deploy cybersecurity solutions with this capacity for detection, defense and forensic purposes. One such example includes automated exposure prioritization platforms that use sophisticated attack modeling to identify not only where vulnerabilities exist, but how they can be exploited.
By charting possible attack paths, it becomes possible to identify vulnerabilities and prioritize their remediation according to key risk context. The process helps organizations focus on the small number of exposures that present the gravest possible risk, rather than wasting resources patching issues that pose risk at all.
Best Practices for Using and Building Attack Graphs
1. Base Your Graphs on Accurate Data
The quality and usefulness of an attack graph depend entirely on the accuracy of the input data. This includes information on open ports, software versions, known vulnerabilities (CVEs), user permissions, firewall configurations, and physical or virtual network topology. Inaccurate or outdated data can cause the graph to include invalid attack paths or omit real ones.
To ensure accuracy, integrate attack graph generation tools with continuously updated exposure management platforms, configuration management databases (CMDBs), and endpoint detection and response (EDR) platforms. Automate data ingestion and validation where possible to minimize human error and reduce the chance of working from stale information. This ensures the graph remains a live representation of your environment, not a static artifact.
2. Model Relationships Explicitly and Correctly
Attack graphs must represent how real-world system states and conditions enable or constrain attacker movement. This requires accurate modeling of exploit dependencies, such as authentication, network reachability, required user privileges, and platform-specific conditions.
For example, a privilege escalation exploit might only be valid if the attacker already has local user access and the target host is running a specific kernel version. If the graph omits these preconditions, it may falsely suggest the exploit is universally applicable. Similarly, network segmentation or access control lists (ACLs) must be accounted for when modeling lateral movement, or the graph will overstate the attacker’s ability to pivot.
3. Integrate with Threat Modeling
Attack graphs gain strategic value when aligned with established threat modeling frameworks like STRIDE, DREAD, PASTA, or MITRE ATT&CK. This integration helps contextualize technical vulnerabilities in terms of attacker goals, behaviors, and tactics.
For instance, a path involving credential theft followed by remote code execution can be mapped to MITRE techniques like T1003 (Credential Dumping) and T1059 (Command and Scripting Interpreter). This allows teams to assess whether current detection and response mechanisms address the specific techniques represented in the graph.
4. Incorporate Probability and Risk Metrics
Attack graphs can be enriched with quantitative data to support better prioritization. Rather than treating all attack paths as equally plausible, you can annotate them with probabilities—such as the likelihood of successful exploit execution, exploit availability in the wild, or attacker required sophistication.
These values can be derived from vulnerability scoring systems like CVSS, exploit databases (e.g., Exploit-DB), or internal red team data. Combined with business context—like the criticality of affected assets or regulatory impact of a breach—this enables calculation of composite risk scores for each path or node.
5. Use Graphs in Exercises and Testing
Attack graphs are not just planning tools; they can be used actively in cybersecurity exercises. During red team operations, graphs can guide attack planning by identifying likely pivot points and privilege escalation paths. During blue team exercises or purple team engagements, they can be used to validate whether detection and mitigation mechanisms can break critical parts of the attack chain.
For example, a red team might simulate a phishing attack to gain initial access, then use the graph to identify lateral movement paths. The blue team can use the same graph to evaluate if endpoint detection tools trigger at expected points or if segmentation controls successfully block attacker movement.
6. Combine with Other Models
Attack graphs provide a technical view of how vulnerabilities interact across systems, but they become more powerful when layered with complementary models. For example, combining attack graphs with asset dependency maps allows teams to assess how compromise of a low-privilege machine could affect mission-critical services downstream.
Similarly, mapping graph nodes to business impact models can show how exploitation of a specific service translates to financial or operational loss. Integration with the cyber kill chain can help place graph insights within the broader attack lifecycle, clarifying where prevention, detection, or response mechanisms should be focused.
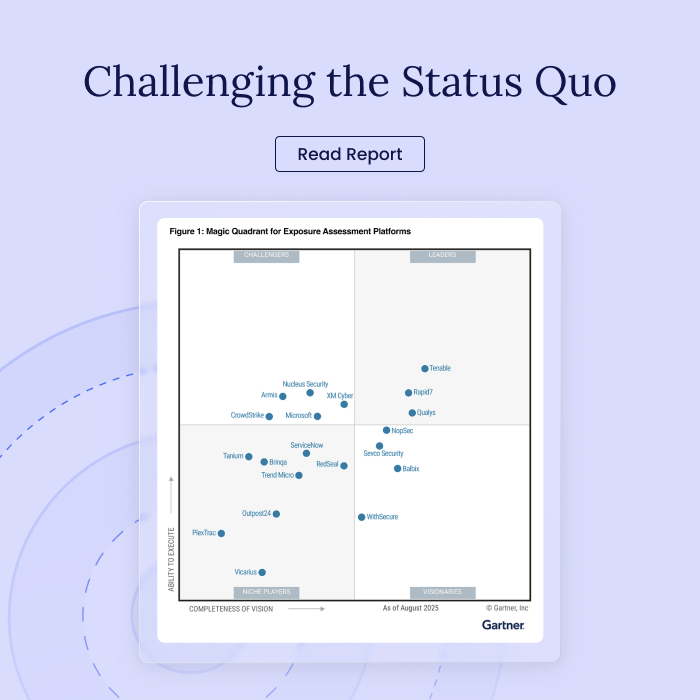
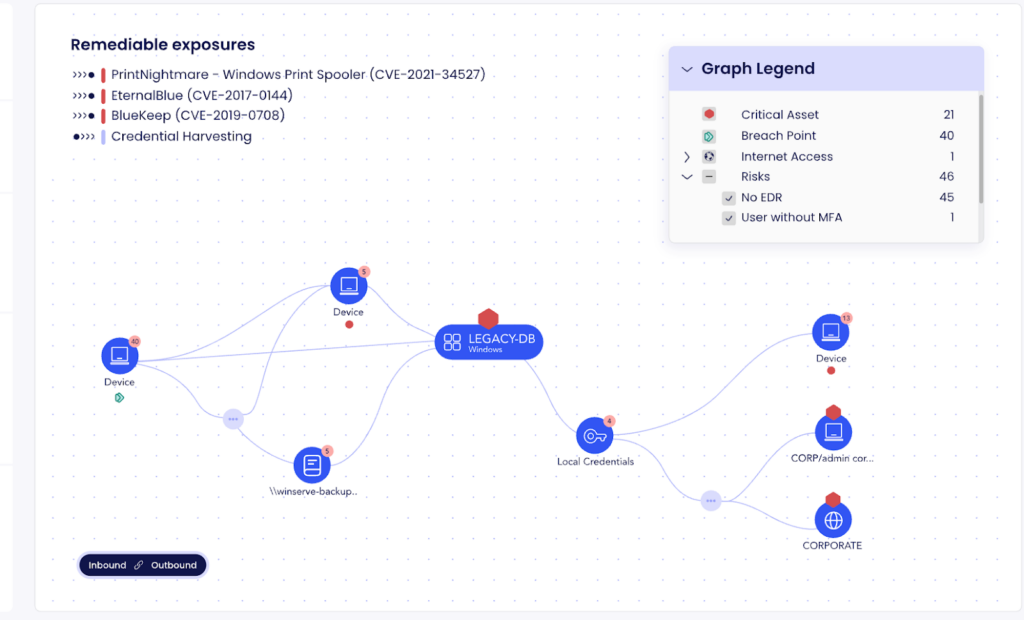
Attack Graphs in XM Cyber
The XM Cyber attack graph enables organizations to identify all attack paths to business-critical assets and focus on choke points, i.e., exposures that lie on attack path junctions leading to critical assetsI. It also provides guided remediation options By mapping out compromising techniques and their connections, you can prioritize remediation efforts to prevent attackers from advancing within or between environments.