Here’s something that should send a shiver down the spine of cybersecurity professionals and business leaders: The odds say that your organization will be victimized by a ransomware attack in the next 12 months.
In 2021, the global ransomware victimization rate for businesses reached 68.5-percent, according to Statista. This is the highest figure in history.
This troubling statistic should shake organizations out of their complacency and serve as a clarion call for urgent action. We now know that the vast majority of companies are going to be victims of ransomware attacks. It’s merely a matter of time – and time is running out.
What truly matters, however, is how these organizations respond.
It is beyond question that cybersecurity professionals understand the extensive damage that ransomware and other attacks resulting in data leaks can cause to an organization.
These damages are not merely financial. In addition to perhaps paying tens of millions of dollars in ransom and other attack-related costs, victimized companies absorb a terrible blow to their reputation and image.
Fortunately, there is a single step you can take right now to significantly lower ransomware risk: Effective management of your attack paths.
Once attackers gain access to your network, they typically must analyze and map all possible attack paths. Doing so allows them to reach critical assets and leak or encrypt them.
Here’s the problem: If there are more than a few users and servers in your environment, it is almost certain that you have thousands — or even millions — of potential attack vectors.
To improve their odds of success, attackers in these situations must think graphically and search for a variety of attack vectors across the network.
In this blog post, we will show you how XM Cyber’s attack path management platform allows your organization to gain the attacker’s perspective. Our technology gives you the powerful ability to look at your network graphically, identify all possible attack vectors, and model offensive techniques to defend your assets.
Gaining this perspective is a critically important step toward lowering the elevated risk you now face from sophisticated ransomware attacks.

The Root of All Attacks
Ransomware attacks, like other types of threats that can fatally damage your organization, are merely the impact of successful exploitation.
Ultimately, the same factors always must be present for an attacker to successfully execute an attack. These are:
- Unpatched vulnerabilities
- System misconfigurations
- Credential abuse
- Exploitation of user errors
Given that today’s organizations feature hundreds, thousands, or even tens of thousands of users and computers, they can be certain of a few things: New vulnerabilities will always emerge, misconfigurations will often happen and users may ignore security guidelines.
All these things are precisely what attackers are counting on.
What can organizations do? Characterizing and understanding each possible attack vector is an essential first step. Yet with thousands and even hundreds of thousands of attack vector scenarios, how do we even begin to manage the risks in the organization?
See Your Network Through the Attackers’ Eyes
Attackers think graphically, trying to understand the victim’s network as broadly as possible to find all the attack vectors that suit their needs.
Because of this, we, as defenders, need to see our network as a complex ecosystem. This means understanding how each object in our network affects the others and what the most significant exposures are.
The graph-based approach illustrates the exact impact of each exposure and starts with the most important cases. Instead of going through a long list of remediation reports, an Attack Path Management platform uses a graph-based approach to calculate machines identified as choke points.
Choke points define entities that affect a large percentage of critical assets — essentially the key intersections through which most attack paths will traverse.
Using this approach allows us to decide how remediation activity should be prioritized.
Understanding Your Attack Surface
Using the scenario hub within an attack-path management platform, we can tailor a scenario to meet our needs, such as identifying the breach points and critical assets most attractive to an attacker. We can also choose to focus the attack on a small number of entities within our network and even choose techniques we would rather not use.
The first step is defining the entities in our network that will be involved in an attack scenario (sometimes we may wish to define a limited number of entities/areas in our network where the attack will occur to conduct a risk assessment only focused on these points.)
Then we define the breach points.

Breach points define the initial foothold the attacker gained from which we want to measure risk. In the example above, we chose USERAA01 to be our breach point.
Next, we can define our critical assets: Any asset that if attacked will cause significant damage to the business. In essence, these are what attackers are seeking.
XM Cyber provides a variety of critical asset rules that allows you to automatically choose the critical assets specific to your organization.

Discover All Possible Attack Paths
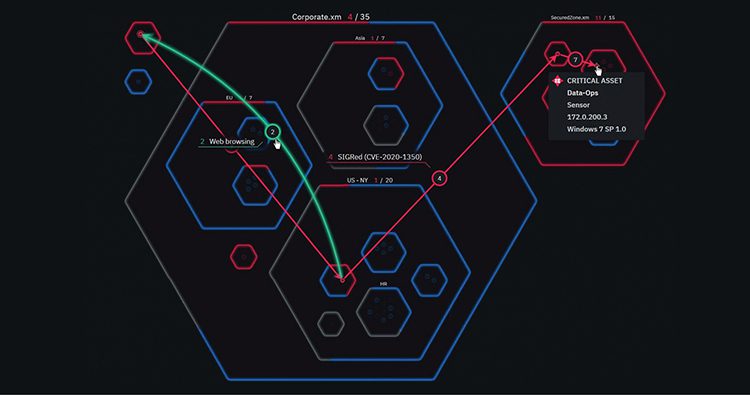
XM Cyber’s battleground is a great way to represent your environment with a graph-based perspective of how an attacker can propagate through your on-premises or cloud networks.
By itself, this visualization can often provide an enormous amount of information about your network ecosystem.

The hexagons represent different network locations. Different areas can be divided in various ways, such as Domains, Organization Units, and Subnets.
The battleground allows you to view which objects the attacker has managed to discover on the network and which ones he managed to attack and gain a foothold.
The arrows represent different types of techniques the attacker uses to compromise critical assets in the environment. These techniques are a combination of vulnerabilities, misconfigurations, mismanaged identities, and user behavior issues.
The blue nodes are nodes that were discovered by the attacker (by using discovery techniques that mimic the behavior of an attacker in the network). When the blue node turns to red, it means that the attacker has the capability to put its footprint on the endpoint/user/server.
Security solutions such as EDR and AV no longer provide adequate protection for your network. With the battleground, it’s easier to understand how that attacker will move laterally within your environment, as well as which remediation actions you will need to perform — and where — to achieve the best ROI.

Effective Mitigation Using Reports
Once the system has analyzed the network, and the virtual attacker can detect all possible attack paths on the network, we must now translate these attack paths into an actionable and prioritized remediation plan that prevents a real attacker from exploiting them.
Since the network is dynamic and undergoes continuous changes based on business needs, there are countless attack paths at any given moment. How can we begin to manage our risks and understand where we need to start?
To meet these challenges XM Cyber provides several perspectives on the reports. Each approach is tailored to the different needs and problems we – the defenders – encounter daily when we conduct risk assessments in our organization. For instance, if we want to address a particular attack technique that impacts the entire network, or if we want to focus first on our choke points and the critical assets in our network.
The Technique-based Prism
Going through all the attack techniques found on the network is the first way to start looking at reports.
This approach is convenient when we want to resolve vulnerabilities, misconfigurations, or problems with user behavior across all networks.
For each technique, we can see how it affects the network; that is, how many critical assets it was able to compromise, and how many choke points it used.
In this way, we can begin to eliminate the most critical techniques first and define a prioritized remediation plan.


For example, CVE-2021-34527 affects many critical assets in the network, and by patching the entire network against this vulnerability, we can prevent many critical assets from being compromised.

By clicking the ‘View Remediation’ button, we can see all the assets affected by this vulnerability and all the recommended remediations.
The Entities Impact Prism
Another way to look at the reports is from the perspective of the entities. The system automatically displays all entities designated as choke points in our network, so that for each choke point we can see all the affected assets. In very large cases there are certain entities that affect a relatively large amount of assets.
For each entity, we can easily see all the information about it including the inbound attacks that compromise it, as well as all the outbound attacks that can be made from it towards other entities.
Most importantly we can identify all the remediations we need to perform to completely block all these attack paths.
With a strategy that covers each of the most critical choke points, preventing attacks on them and from them, security teams can focus on remediating the most critical entities that could cause significant impact to an organization if breached. As a result, they can achieve a high return on investment for the organization’s security posture in a very short amount of time.
In the following example we can see different entities that affect a relatively high amount of assets:

Once we have entered a specific entity, it immediately appears that there are four different techniques by which the host named USERAA01 can be compromised:
aPAColypse (CVE-2017-11907), Domain Credentials, PrintNightmare – Windows Print Spooler (CVE-2021-34527), Group Policy Modification.
We can see all possible inbound attacks toward the entity using the inbound graph:


We can see all possible outbound attack techniques that can be performed from the USERAA01 entity to other assets in the network:

In the example above, USERAA01 can easily compromise the DC with the Zerologon (CVE-2020-1472) technique.

And in another example, USERAA01 can compromise an SQL Database with a more complex attack path:

Finally, after realizing the huge impact that USERAA01 alone has on the level of security in our network, we are presented with all the relevant remediations, which will help us easily and effectively disable all the techniques that the attacker can use to attack USERAA0 or to attack from USERAA01 against other assets on the network:

Conclusion
Ransomware attacks, much like other types of attacks, are merely the result of effective network propagation and exploitation of weaknesses in the internal network. The techniques used in the exploitation process vary between vulnerabilities, misconfiguration, mismanaged identities, and user behavior.
Using XM Cyber’s graph-based approach allows you to easily visualize all possible attack vectors in the network and build a prioritized and actionable remediation plan to significantly improve your organization’s security posture, ultimately reducing your attack surface where resources and time don’t constitute a constraint.
Zur Ulianizky is Head of Security Research at XM Cyber
Ofir Balassiano is Senior Security Researcher at XM Cyber
Read more: